RAWGraphs is an open-source web application developed by the DensityDesign Lab and Calibro, designed to make complex data visualization accessible to non-specialists. It acts as a bridge between spreadsheet applications and vector graphics editors, allowing users to create unique, custom visual models from tabular data. The core feature is its ability to map data dimensions to visual variables (position, size, color, etc.) using a variety of less common chart layouts, enabling exploration beyond standard bar or pie charts. It's primarily built for designers, researchers, and anyone looking to create distinctive data visualizations that can be further refined in vector editing software. Users open RAWGraphs when they have tabular data and want to explore its hidden patterns or present it using novel chart types not available in standard tools. It works entirely in the browser, ensuring data privacy as no data is uploaded to a server, and allows direct export to SVG, PNG, or JSON.
Editorial check
How this page is checked
Source trail
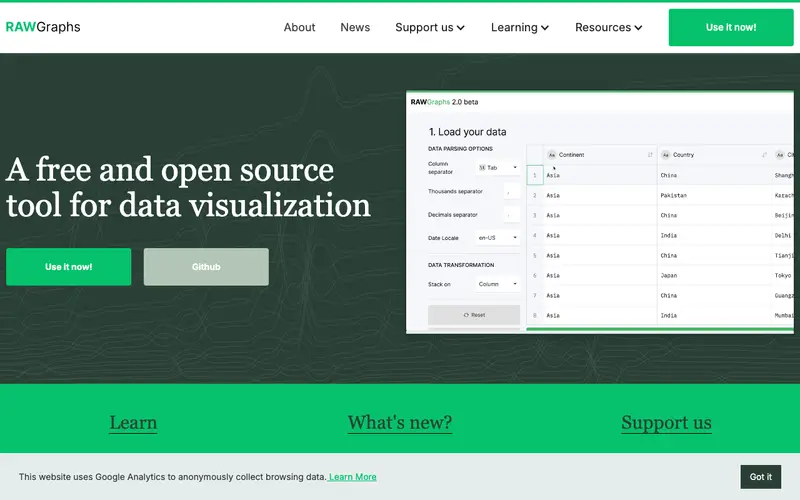
rawgraphs.io
External links are separated from Surfaced commentary.
Reader safety
Context before clicks
Product links and external services are not presented as guarantees.
Monetization
No affiliate flag
Ads and commerce links are kept distinct from editorial text.
Surfaced take
Why It’s Useful
RAWGraphs provides a unique intermediate step for creating bespoke visualizations that are often difficult or impossible with mainstream tools like Excel or Google Sheets, bridging the gap to design software. For the academic researcher needing to visualize complex relational data in a specific, non-standard diagram for a journal publication, RAWGraphs offers unparalleled flexibility. For the graphic designer tasked with creating a compelling infographic, it allows for rapid prototyping of unique visual forms before moving to Illustrator for final polish. It is completely free and open-source, promoting transparency and community contribution. Many users discover the ability to modify and extend existing chart templates with custom code only after exploring its capabilities, unlocking deeper customization. It's not more popular because it requires a slightly higher degree of visual literacy and often necessitates further design work in a separate tool, making it less "one-click" than simpler solutions. The project is actively maintained, with regular updates to its chart library and a community of users contributing feedback and ideas.


Enjoyed this? Get five picks like this every morning.
Free daily newsletter — zero spam, unsubscribe anytime.