Chartbrew is an open-source web application, developed by a small independent team, designed for creating real-time dashboards and charts from various data sources. Its core feature is a flexible interface that allows users to connect to databases (like PostgreSQL, MySQL, MongoDB), APIs, or CSV files, and then build custom visualizations and shareable dashboards. This tool is primarily built for developers, product managers, and small businesses who need to monitor key metrics, track application performance, or visualize internal data without relying on expensive proprietary BI tools. Users typically turn to Chartbrew when they want to consolidate data from different systems into a single, customizable dashboard for ongoing monitoring or reporting. It offers integrations with numerous databases and allows for custom API connections.
Editorial check
How this page is checked
Source trail
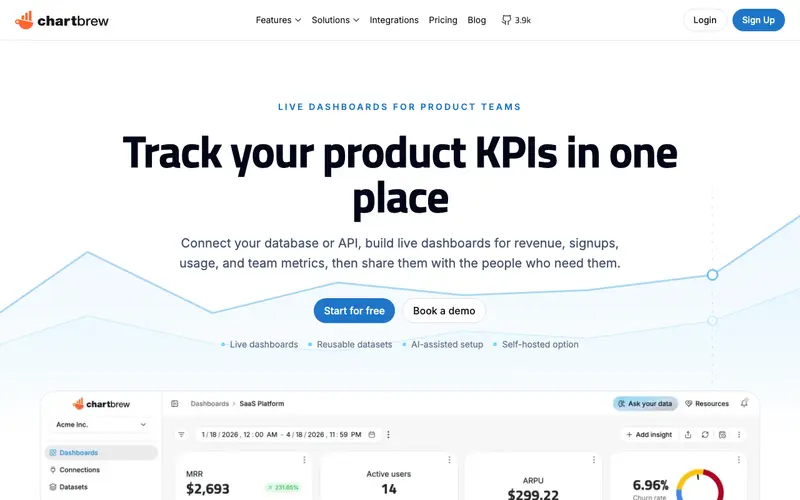
chartbrew.com
External links are separated from Surfaced commentary.
Reader safety
Context before clicks
Product links and external services are not presented as guarantees.
Monetization
No affiliate flag
Ads and commerce links are kept distinct from editorial text.
Surfaced take
Why It’s Useful
Compared to commercial BI dashboards like Tableau or Power BI, Chartbrew provides an open-source, self-hostable alternative, offering greater control, flexibility, and cost savings for specific use cases. For the startup founder monitoring user engagement, Chartbrew lets them pull data from their application database and Google Analytics into a single, real-time dashboard. A development team can use it to track API performance and error rates, building custom views tailored to their operational needs. Chartbrew is completely free and open-source, with self-hosting being the primary model, though a hosted version might be available from third parties. A powerful feature often overlooked is its ability to build custom queries directly within the interface for advanced data manipulation before visualization. Its self-hostable nature and focus on developers for initial setup can be a barrier for non-technical users, preventing wider adoption despite its powerful capabilities. The project has an active GitHub repository, a Discord community, and receives consistent updates and new integrations.


Enjoyed this? Get five picks like this every morning.
Free daily newsletter — zero spam, unsubscribe anytime.