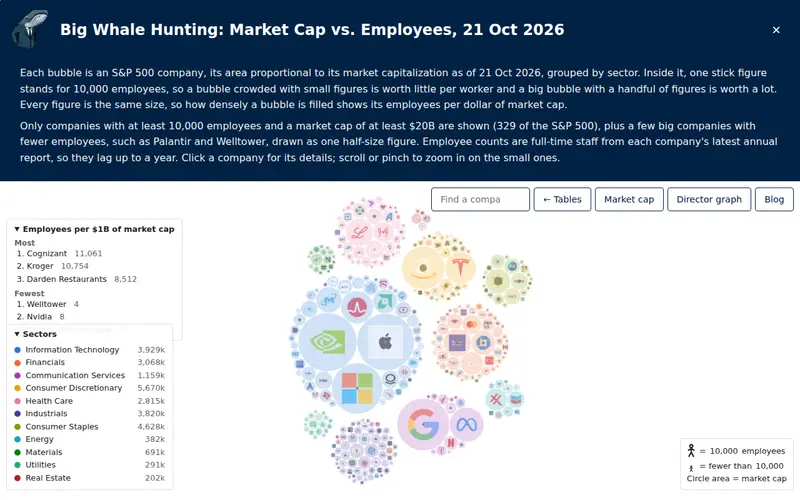
This interactive data visualization project, hosted on BigWhaleHunting.com, illustrates the size of major S&P 500 companies by their market capitalization, represented as bubbles. Within each bubble, the number of employees for that company is visually depicted. The tool allows users to explore the relationship between a company's financial valuation and its workforce size, offering a unique perspective on corporate scale and employment.
Editorial check
How this page is checked
Source trail
bigwhalehunting.com
External links are separated from Surfaced commentary.
Reader safety
Context before clicks
Product links and external services are not presented as guarantees.
Monetization
No affiliate flag
Ads and commerce links are kept distinct from editorial text.
Surfaced take
Why It’s Useful
This tool provides a novel and intuitive way to grasp complex corporate financial data that is often presented in dry tables or charts. By using visual metaphors like bubbles and relative sizes, it makes the sheer scale of multinational corporations and their employee counts immediately apparent. It's particularly useful for journalists, students, or anyone trying to contextualize business news. The creator, who appears to be an individual developer or researcher, offers a more artistic and less corporate approach to data visualization than many professional tools, making the information more engaging and memorable.
In everyday life
When you’d actually reach for this
You're reading a business news article about tech giants and want a quick, visual sense of how their employee numbers compare to their market value. You visit the site to see the colorful bubbles and get an instant understanding.


Enjoyed this? Get five picks like this every morning.
Free daily newsletter — zero spam, unsubscribe anytime.