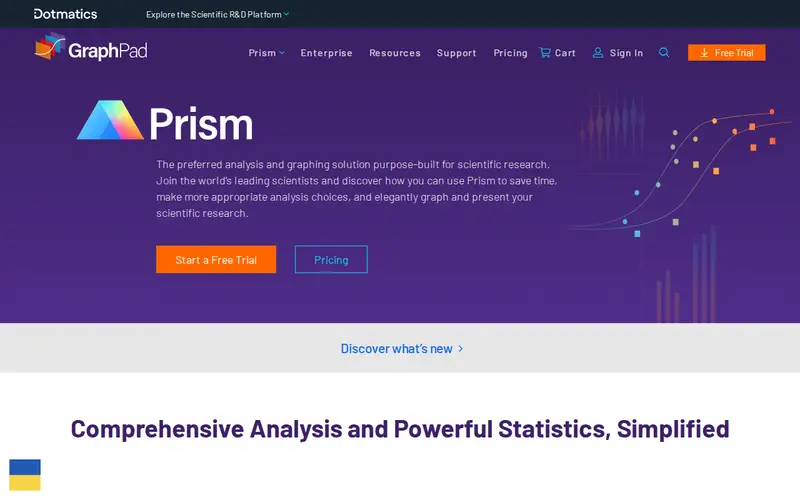
GraphPad Prism is statistical software designed for scientists and researchers, integrating data analysis, curve fitting, and scientific graphing into a single, intuitive interface. It's particularly renowned for its ease of use, enabling complex statistical tests and elegant graph creation without requiring extensive programming knowledge. Prism operates on a paid license model. It stands out for its ability to seamlessly translate complex experimental data into clear, publication-ready figures.
Editorial check
How this page is checked
Source trail
graphpad.com
External links are separated from Surfaced commentary.
Reader safety
Context before clicks
Product links and external services are not presented as guarantees.
Monetization
No affiliate flag
Ads and commerce links are kept distinct from editorial text.
Surfaced take
Why It’s Useful
For anyone working in scientific research, experimental design, or data-driven fields, GraphPad Prism is an invaluable asset. It significantly streamlines the process of analyzing experimental results and presenting them effectively. Its guided approach to statistical analysis helps researchers choose appropriate tests, reducing the risk of misinterpretation. The sophisticated graphing capabilities allow for the creation of professional-quality figures for reports, presentations, and publications, saving considerable time and effort compared to using separate programs for analysis and visualization. It empowers researchers to focus more on their experiments and less on the complexities of data management.
In everyday life
When you’d actually reach for this
After running an experiment, you can input your results into GraphPad Prism. The software will help you perform statistical analysis and create professional-looking charts to understand your findings and present them to colleagues or in a research paper.





Enjoyed this? Get five picks like this every morning.
Free daily newsletter — zero spam, unsubscribe anytime.