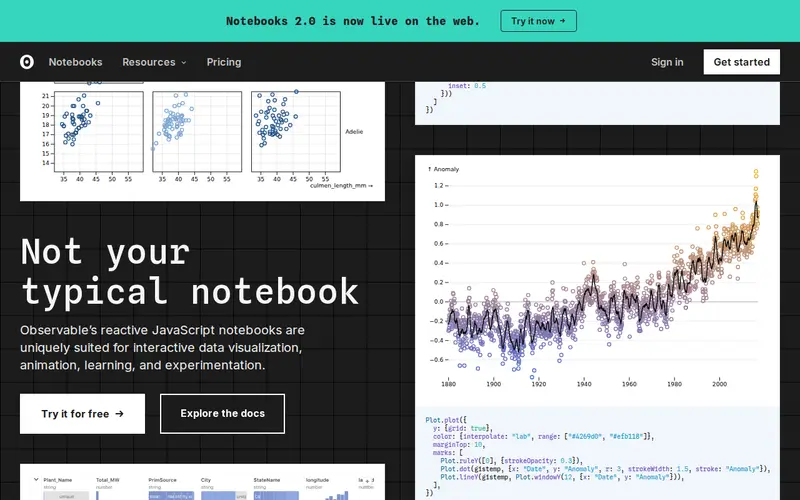
Observablehq is a reactive notebook environment designed for data exploration, visualization, and sharing. It allows users to write JavaScript code that runs directly in the browser, creating interactive charts, dashboards, and reports that update automatically as data or code changes. The platform is free for public notebooks and offers paid tiers for private projects and enterprise needs. Its unique reactivity model means that changes to one part of your notebook seamlessly update dependent elements, making complex data storytelling more intuitive than traditional static coding environments.
Editorial check
How this page is checked
Source trail
observablehq.com
External links are separated from Surfaced commentary.
Reader safety
Context before clicks
Product links and external services are not presented as guarantees.
Monetization
No affiliate flag
Ads and commerce links are kept distinct from editorial text.
Surfaced take
Why It’s Useful
This tool is exceptional for anyone involved in data analysis, research, or education who needs to present dynamic insights. Students learning data science can build interactive projects that are immediately engaging and shareable. Researchers can create compelling visualizations that allow audiences to explore data themselves, fostering deeper understanding. Educators can use it to demonstrate complex concepts in real-time, making abstract theories tangible. The collaborative features also allow teams to work together on data projects, share findings, and iterate on analyses efficiently. Its emphasis on interactive, web-based outputs makes data accessible and understandable to a broader audience.
In everyday life
When you’d actually reach for this
You're trying to make sense of your household budget for the month and want to visualize spending trends. Planning a group gift for a friend, you need an easy way to track contributions and see who owes what in real-time.







Enjoyed this? Get five picks like this every morning.
Free daily newsletter — zero spam, unsubscribe anytime.