Photo via Pexels
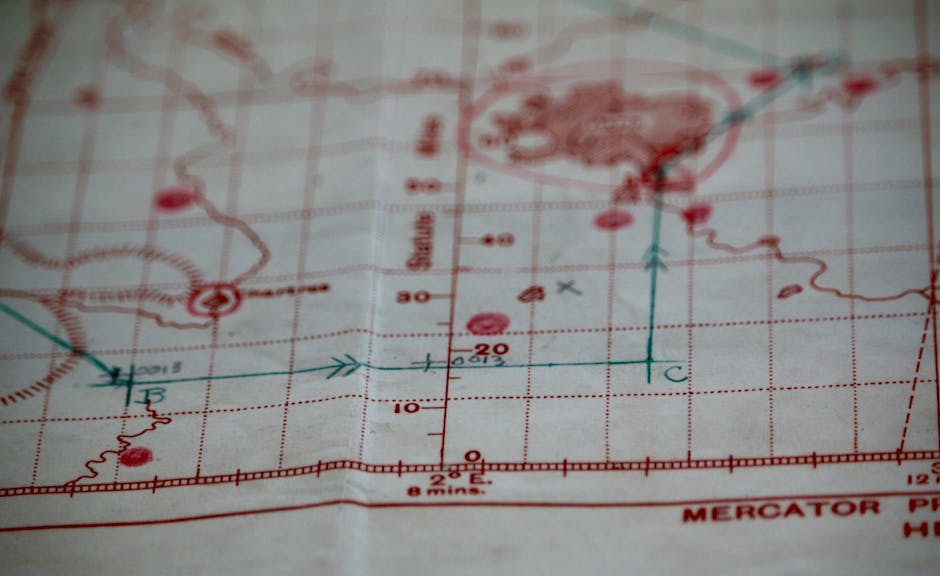
The Historical Map Projects Census Viewer is a specialized online tool that allows users to visualize and explore historical United States census data overlaid onto historical maps. It provides access to digitized historical maps from the Library of Congress and other institutions, which can then be layered with demographic information from various census years. Developed by researchers at the University of Wisconsin-Madison, it aims to make historical demographic data more accessible for research and education.
Editorial check
How this page is checked
Source trail
historicalmap.uvic.ca
External links are separated from Surfaced commentary.
Reader safety
Context before clicks
Product links and external services are not presented as guarantees.
Monetization
No affiliate flag
Ads and commerce links are kept distinct from editorial text.
Surfaced take
Why It’s Useful
Most people encounter census data in dry tables or reports. This tool transforms that by visually integrating demographic shifts with the physical geography of the past. It’s far more intuitive for understanding migration patterns, settlement growth, and the spatial distribution of populations than traditional methods. Its value lies in bridging historical cartography with social science data, offering unique insights for genealogists, historians, urban planners, and anyone curious about how America has evolved geographically and demographically. The ability to compare different census years on a single map is particularly powerful.
In everyday life
When you’d actually reach for this
You're researching your family history and want to see where your ancestors might have lived in the late 19th century, not just by street address, but by understanding the broader neighborhood demographics and land use patterns of that era.







Enjoyed this? Get five picks like this every morning.
Free daily newsletter — zero spam, unsubscribe anytime.