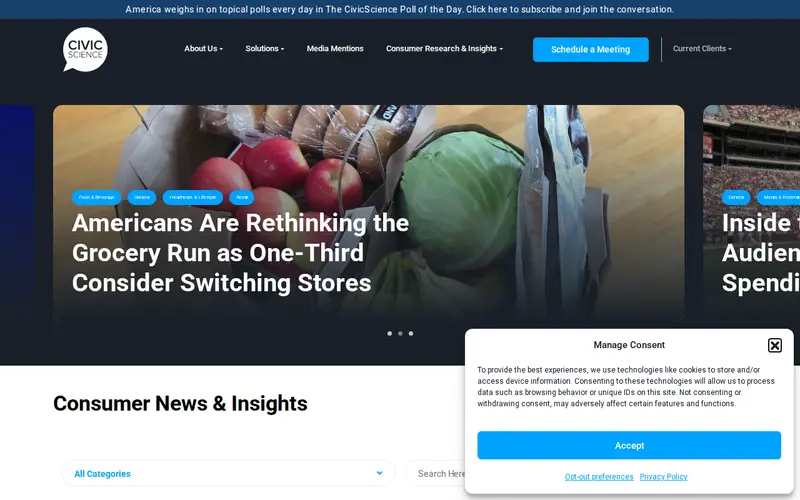
Civic Science Visualizations provides a dynamic and intuitive platform for exploring complex public opinion data concerning science and technology. Through a rich array of interactive charts, detailed graphs, and informative timelines, users can readily access and understand research findings. This approach demystifies intricate statistical information, enabling individuals to discern trends, identify correlations, and grasp evolving public sentiment on critical societal topics without requiring specialized analytical skills. The resource is freely available, dedicated to making significant societal data and research accessible to a broader audience.
Editorial check
How this page is checked
Source trail
civicscience.com
External links are separated from Surfaced commentary.
Reader safety
Context before clicks
Product links and external services are not presented as guarantees.
Monetization
No affiliate flag
Ads and commerce links are kept distinct from editorial text.
Surfaced take
Why It’s Useful
This visualization tool serves as a crucial bridge, translating complex datasets into easily digestible insights for public comprehension. Instead of navigating through extensive academic papers or lengthy reports, users can engage with visual representations of public attitudes towards subjects such as climate change, artificial intelligence, and vaccine confidence. This makes it an exceptionally valuable resource for students seeking to understand research, journalists requiring data-driven narratives, and any curious individual aiming to comprehend the nuances of evidence-backed societal issues. The interactive nature encourages independent exploration and discovery, fostering enhanced critical thinking and facilitating more informed discussions on subjects profoundly shaping our global landscape.
In everyday life
When you’d actually reach for this
If you're curious about public attitudes towards a new technology or environmental policy, you can visit Civic Science Visualizations to see interactive charts showing how opinions have shifted. It helps you quickly grasp complex social trends with clear, visual data.







Enjoyed this? Get five picks like this every morning.
Free daily newsletter — zero spam, unsubscribe anytime.