Kepler.gl is a high-performance web-based geospatial analysis tool for large-scale datasets, developed by Uber Technologies. It allows users to visualize large geospatial datasets, generate interactive maps, and perform exploratory data analysis directly in the browser. Its core feature is the ability to render millions of data points on a map quickly, supporting various layer types like points, arcs, heatmaps, and 3D extrusions. It's built for data scientists, urban planners, and researchers who need to visualize geographic data trends and patterns. Someone would use Kepler.gl when they have location-based data (e.g., taxi trips, sensor readings, delivery routes) and want to uncover spatial relationships or anomalies. It integrates with various data sources like CSV, JSON, and GeoJSON files, and can be embedded into custom web applications.
Editorial check
How this page is checked
Source trail
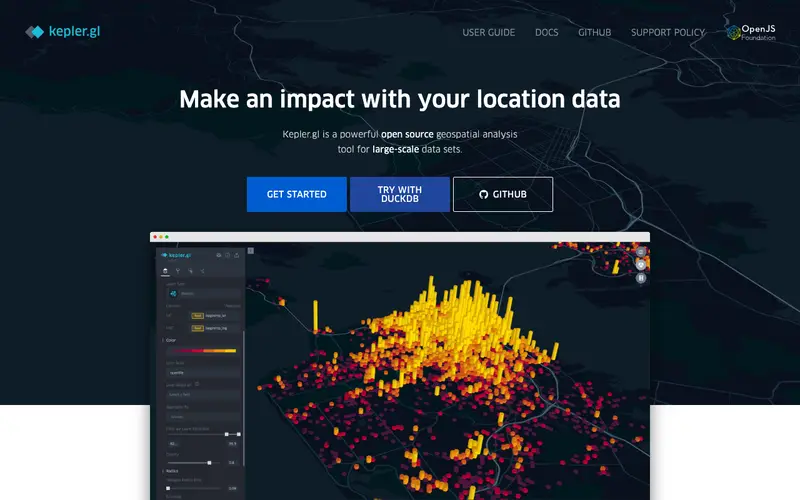
kepler.gl
External links are separated from Surfaced commentary.
Reader safety
Context before clicks
Product links and external services are not presented as guarantees.
Monetization
No affiliate flag
Ads and commerce links are kept distinct from editorial text.
Surfaced take
Why It’s Useful
Unlike standard mapping APIs or simple GIS tools, Kepler.gl is optimized for performance with massive datasets, making it superior for big data geospatial visualization where other tools might lag or crash. For the logistics manager analyzing fleet movements, Kepler.gl can visualize millions of historical routes to identify bottlenecks or inefficient patterns, providing insights that static maps cannot. For the urban researcher studying population density changes, it offers interactive filtering and aggregation capabilities to reveal demographic shifts over time in specific areas. It is completely free and open-source. A feature many users don't immediately discover is the ability to create and animate temporal data, showing changes over time, which is incredibly powerful for dynamic analysis. It's not more popular outside data science circles because its focus on large-scale geospatial data makes it highly specialized, and while user-friendly, setting up complex analyses still requires some technical understanding. It has a growing developer community and is actively maintained by Uber and open-source contributors.


Enjoyed this? Get five picks like this every morning.
Free daily newsletter — zero spam, unsubscribe anytime.