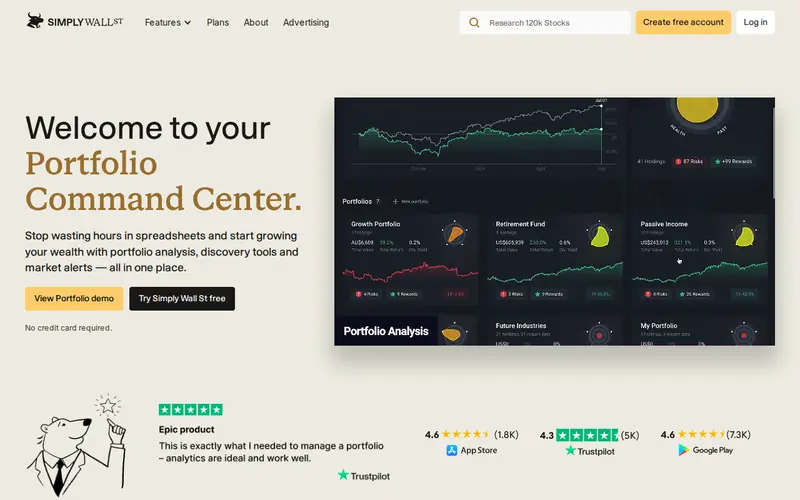
This platform provides a suite of tools for fundamental and technical analysis of publicly traded stocks. It offers in-depth financial statements, valuation metrics, historical performance data, and charting capabilities. Users can screen for stocks based on various criteria, build watchlists, and access analyst ratings. The service is typically offered on a freemium or subscription basis, with basic features available for free and advanced analytics requiring a paid plan. It excels at consolidating complex financial data into an accessible format.
Editorial check
How this page is checked
Source trail
simplywall.st
External links are separated from Surfaced commentary.
Reader safety
Context before clicks
Product links and external services are not presented as guarantees.
Monetization
No affiliate flag
Ads and commerce links are kept distinct from editorial text.
Surfaced take
Why It’s Useful
For investors looking to make informed decisions, this tool cuts through the noise of the stock market by providing meticulously organized and comprehensive data. Its powerful screening capabilities help identify potential investment opportunities that align with specific strategies, saving hours of manual research. The integration of both fundamental and technical indicators allows for a holistic view of a company's health and market sentiment. Users appreciate the ability to backtest strategies and the clear visualizations of complex financial information, making it a valuable resource for both novice and experienced traders.
In everyday life
When you’d actually reach for this
You might use it on a Saturday morning to research a company you're interested in, checking its revenue growth and profit margins. Later, you could use its charting tools to analyze price trends before making an investment decision for the coming week.







Enjoyed this? Get five picks like this every morning.
Free daily newsletter — zero spam, unsubscribe anytime.